How do I guage the financial performance of my booking business
Leveraging your organizational booking data
Typically, businesses have key performance indicators to track financial health and performance. Meeting Hub has you covered, providing you with a real-time quarterly snapshot of the performance of your booking business, across three industry standard benchmarks. These are booking value ($), booking volume, and crucially occupancy / utilisation.
The three indicators are used to identify potential issues within your booking business. A high booking volume with a low booking value and high occupancy may indicate your pricing is too low or there is potentially unauthorised discounting. Whereas, a high booking value with a low booking volume, coupled with low occupancy may be indicative of pricing your spaces outside the tolerance of your local market. Ideally, you should strive for an occupancy / utilisation rate above 85%, on the basis that most of your costs to deliver services are fixed and are incurred irrespective of whether the space is utilised or not.
Lets take a look at the Organizational Booking Data report in more detail:
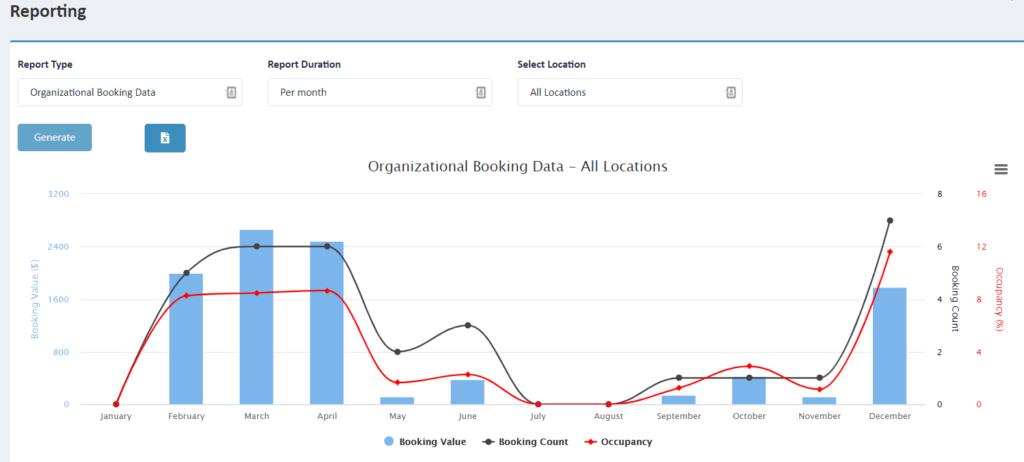
- The Report Type filter: Select the report to view, in this case, Organizational Booking Data
- Report Duration: Filter based on your preferred duration (E.g. per month or per year)
- Select Locations: Allows you to look at a single Location or 'all' Locations.
- Select Space Name: If you have selected a single Location, you can view all Spaces or drill down to a single Space.
- Generate: The generate button when clicked displays a graphical representation of the selected data in bar graph format.
- Excel: The Excel button when clicked downloads a csv. file including the selected data.
- Once you have generated the graphical representation, hover over the segments within each bar or line for more granular detail.