How can I view the average spend per booking for my spaces
Understanding the average booking spend for your spaces
Understanding the average spend per booking data will enable you to make informed decisions on how to best manage your spaces. For example, a low average spend per booking could be indicative of over discounting for this space, or an indication of giving away too much free (gratis) time. The Average Spend Per Booking report displays, based on selected filters, what the average monetary value is per booking, E.g. you can choose to include or exclude items such as amenities or taxes. Let's take a look at the report in detail:
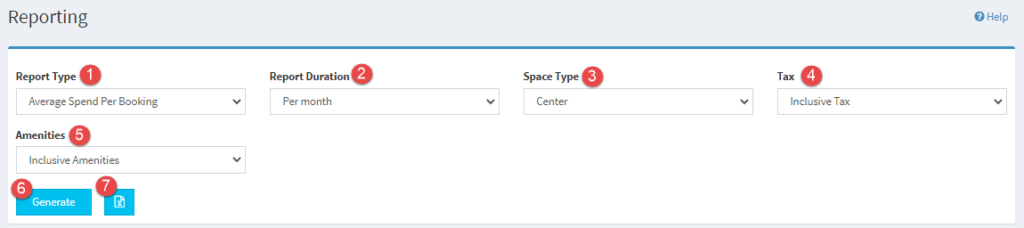
- Report Type filter: Select the report you would like to view, in this case, Average Spend Per Booking
- Report Duration: Filter based on your preferred duration (E.g. per month or per year)
- Space Type: Filter based on your preferred space type (E.g. Center/Facility, Client, Meeting Room and User)
- Tax: Include or exclude taxes as required
- Amenities: Include or exclude amenities (additional services that can be reserved or paid for at the time of booking, such as catering or audiovisual equipment)
- Generate: The generate button when clicked displays a graphical representation of the selected data in bar graph format.
- Excel: The Excel button when clicked downloads a csv. file including the selected data.
Tip: Once you have generated the graphical representation, hover over the segments within each bar for more granular detail.