Understanding your busy times
Aligning staff to peak booking times
Analysing your peak booking periods will allow you to increase profitability of your business by aligning your staff resources to meet your peak booking periods. If you have multiple locations, you may be surprised to learn that it may be possible to reduce or share head count across locations to meet customer demands. Conversely, when you identify drops in demand, you may wish to offer incentives or run campaigns to promote bookings outside of your peak times, such as Friday afternoons or mid-week. The Meeting Hub reports allow you to identify peak booking trends across the organization or by individual location by time of day or day of week, allowing you to deploy your most valuable asset (your people), to provide your customers with the best experience.
The Busy Day of the Week report displays, based on selected filters, the busiest days of the week for a Location or Space Type. Let's look at the report in more detail:
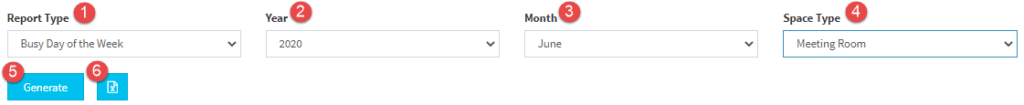
- The Report Type filter: Select the report that you wish to view, in this case, Busy Day of the Week
- Year filter: Filter based on your preferred year
- Month filter: Filter based on your preferred month
- Space Type filter: Filter based on your preferred space type (E.g. Location and Meeting Room).
- Generate: The generate button when clicked displays a graphical representation of the selected data in a heat map format. The darker the colour on the heat map the busier the day is.
- Excel: The Excel button when clicked downloads a csv. file including the selected data.
Tip: Once you have generated the graphical representation, hover over the segments within each table view additional data.
Similarly, the Busy Time of Day report displays, based on selected filters, the busiest times of the day for a Location or Space Type. Let's look at the report in more detail:
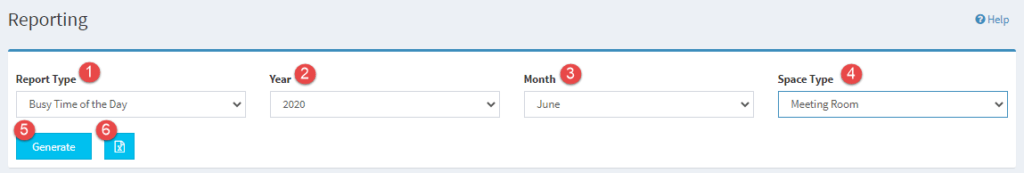
- The Report Type filter: Select the report you wish to view, in this case, Busy Time of the Day
- Year filter: Filter based on your preferred year
- Month filter: Filter based on your preferred month
- Space Type filter: Filter based on your preferred space type (E.g. Location and Meeting Room).
- Generate: The generate button when clicked displays a graphical representation of the selected data in a heat map format. The darker the colour on the heat map, the busier the time of day
- Excel: The Excel button when clicked downloads a csv. file including the selected data


Copyright Ⓒ 2021 Meeting Hub. All Rights Reserved